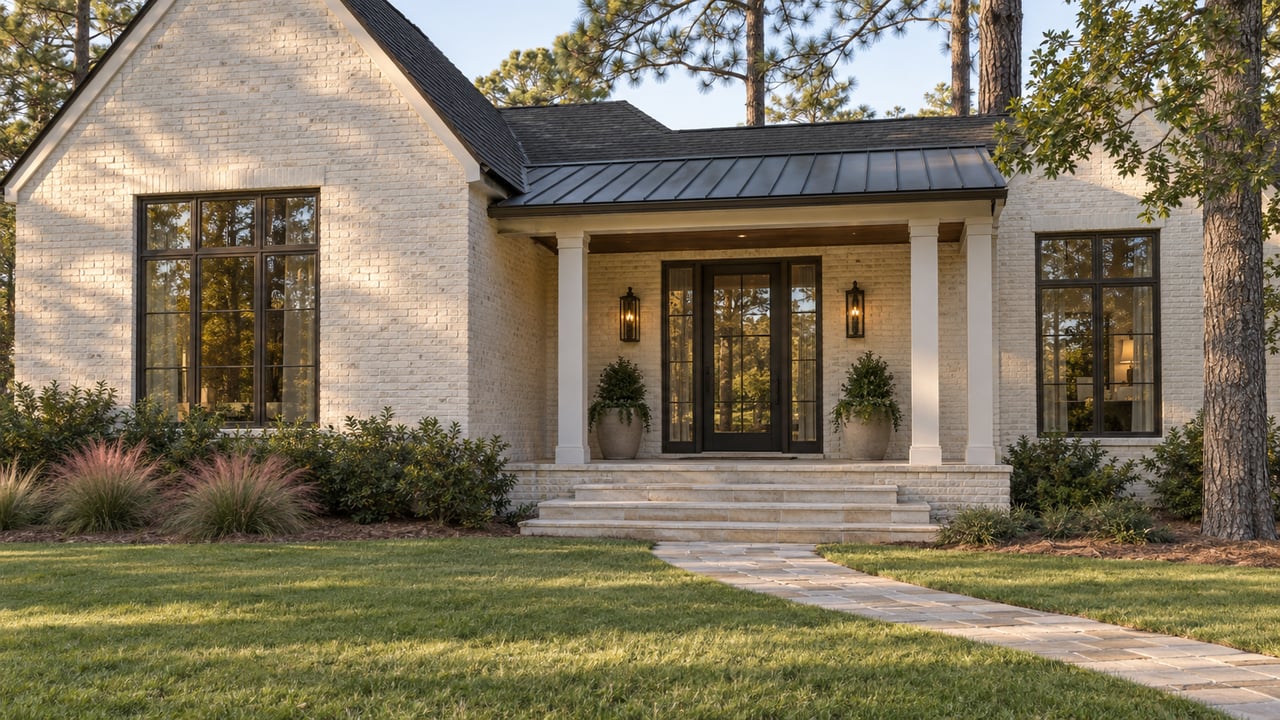
Southern Pines Prices Rose 3.4% This Year. Downtown Fell 12%. Both Numbers Are True.
October 1, 2026
October 1, 2026
If you have started comparing Southern Pines listings against the townwide numbers you saw on a portal, you have probably run into a contradiction and assumed one of the numbers was wrong. It wasn't. Over the three months ending June 2026, Southern Pines' townwide median sale price rose 3.4 percent year over year to $558,000. Over almost the same window, ending in May 2026, the median inside Downtown Southern Pines fell 12.1 percent to $475,000. Both figures come from the same data provider tracking the same town in the same season. Neither is a typo.
The reason is simple once you say it out loud: "Southern Pines" on a listing site is a label for one MLS-defined area that contains housing stock ranging from a walkable historic core to six-acre estates on Midland Road. Averaging those together produces a number that describes no actual house for sale. If you are trying to figure out what your budget buys in a specific pocket of town, the townwide median is the wrong tool, and knowing why is more useful than knowing the number itself.
The disagreement does not stop at one submarket versus the townwide figure. Three separate housing data providers currently describe Southern Pines' direction differently, depending on what each one measures. The townwide sold-price median tracked by Redfin points up 3.4 percent year over year for the three months ending June 2026. Zillow's Home Value Index, a smoothed estimate of typical home value rather than a median of closed sales, shows the town up just 0.6 percent over the trailing year as of its July 31, 2026 update. A third portal's trailing twelve-month figure shows the townwide median down 2 percent over the same general period.
None of these providers is measuring the same thing. One tracks closed sales in a rolling three-month window. Another smooths estimated values across the entire housing stock, including homes that never sold. A third works off a different trailing period entirely. That disagreement at the townwide level is itself useful information. If the professionals building these indexes cannot agree on direction, a single headline median is not a precise enough instrument for comparing what a specific corridor of Southern Pines costs against what you are prepared to spend.
Downtown Southern Pines is the one submarket inside town limits with its own tracked index. Its median fell to $475,000 over the three months ending May 2026, a 12.1 percent drop from the same window a year earlier, even as the broader townwide number climbed to $558,000 over a nearly identical span.
Downtown is the walkable core near the historic Weymouth Heights district, built out with older, smaller-footprint homes closer to Broad Street. When larger or newer construction elsewhere in town closes at higher prices, the townwide median moves up even while the walkable, historic core is transacting at lower numbers than it was a year ago. A buyer using the townwide figure to gauge what a downtown bungalow costs is measuring the wrong market entirely, and the gap between $475,000 and $558,000 is exactly the size of that mistake.
The other shift worth sitting with is speed, not price. A year ago, homes in Southern Pines were selling in roughly 17 days. Over the three months ending June 2026, that average stretched to 52 days, and some measures put current listings closer to 60 days before going under contract. Zillow's separate estimate puts typical time to pending at around 37 days as of late July 2026. However you measure it, the pace has slowed by a wide enough margin to change what a rising median actually tells you.
When homes take three times as long to sell, a rising sold-price median can coexist with softer demand for the broad middle of the market. Fewer transactions closing, concentrated more heavily among higher-priced or larger homes, can lift the median even while ordinary listings sit longer and see less competition. That is not a claim about buyer sentiment. It is a mechanical fact about how medians behave when the mix of what is actually closing shifts. It means the townwide number and the pace at which homes move are two separate signals, and reading only one leaves out half the picture.
Price per square foot inside the Southern Pines MLS boundary currently ranges from $140.98 to $459.66, with a townwide average of $229.27. That range is not noise. It reflects genuinely different products sold under the same town name.
| What it's built around | Price signal | |
|---|---|---|
| Downtown core | Walkable, older housing stock near the historic Weymouth Heights district | $475,000 median, down 12.1% year over year (three months ending May 2026) |
| Midland Road corridor | Large-lot estate properties | Anchors the top of the price-per-square-foot range at $459.66; a six-acre estate on Midland Road listed at $3.35 million in June 2026 |
| Golf-anchored communities (Mid Pines, Pine Needles, Talamore, Palmers Preserve) | Donald Ross-designed courses and gated layouts | No separately tracked index; folds into the townwide average |
| Knollwood and Morganton Road | Equestrian properties and gentleman's farms | No separately tracked index; folds into the townwide average |
| Newer subdivisions (Sandhurst South, Shaw's Landing, The Cottages at Midland) | More recently built homes closer to town infrastructure | No separately tracked index; folds into the townwide average |
The pattern in that table matters as much as any single row. Downtown has its own published index because data providers recognize it as distinct enough to track separately. The golf-anchored communities, the equestrian corridor along Knollwood and Morganton Road, and the newer subdivisions do not get that treatment. Their absence from a separate index is not evidence they are moving in step with the townwide number. It means nobody is publishing a number for them at all, and a buyer comparing those pockets against the townwide median is comparing against a figure that was never built to describe them.
If you are weighing a downtown bungalow against a Midland Road estate or a golf-community listing near Mid Pines, the townwide median will not settle the comparison for you. Price per square foot on recent closings within the specific pocket you are considering, checked against how long comparable homes there have actually taken to sell, gets you closer to a real answer than any single headline figure. The $229.27 townwide average sits between the $140.98 and $459.66 extremes without accurately describing either end.
That gap between the townwide story and the pocket-level reality is exactly where local knowledge earns its keep. Reading a listing correctly means knowing which pocket its comparables should come from, not just what the town-level chart says this quarter.
Does a rising townwide median mean every part of Southern Pines got more expensive this year? No. Downtown Southern Pines' median fell 12.1 percent year over year over the three months ending May 2026, even as the townwide figure rose 3.4 percent over a nearly identical window. The two numbers describe different slices of the same town.
Why are homes taking so much longer to sell than they did a year ago? Average days on market stretched from roughly 17 days a year ago to around 52 days over the three months ending June 2026, with a separate estimate putting typical time to pending closer to 37 days as of late July 2026. The underlying reasons vary by listing, but the shift itself is large enough that a buyer should weigh current time-on-market for a specific type of home rather than assume last year's pace still applies.
Is price per square foot a better way to compare Southern Pines neighborhoods than the median? It is a sharper tool for corridor-level comparisons, since the median blends housing types that do not share a price tier. A $229.27 townwide average per square foot sits between a documented low of $140.98 and a high of $459.66, which tells you the average describes neither end of the range particularly well.
Comparing Southern Pines corridors takes more than a headline number, and getting the comparison right before you write an offer is worth the extra step. Ross Laton has spent decades reading Moore County's neighborhoods block by block. Let's Connect if you want a pocket-level read on what your budget actually buys.
Stay up to date on the latest real estate trends.

With deep roots in Seven Lakes and a passion for helping clients make confident real estate decisions, Ross Laton offers local insight, personalized service, and a seamless experience from start to finish.

SEVEN LAKES REAL ESTATE
103 Fawn Court West End, NC 27376 MON - SAT 8:00AM - 7:00PM SUN 1:00PM - 5:00PM